

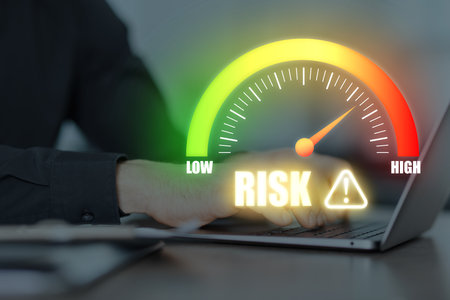
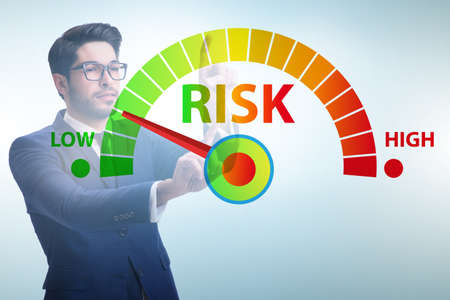
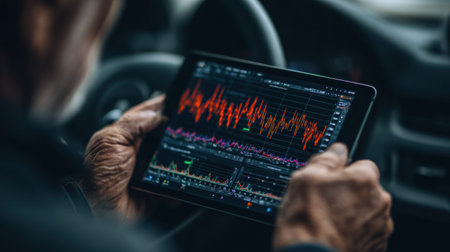
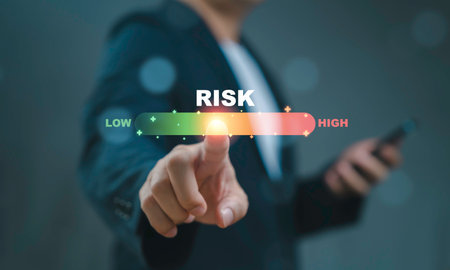
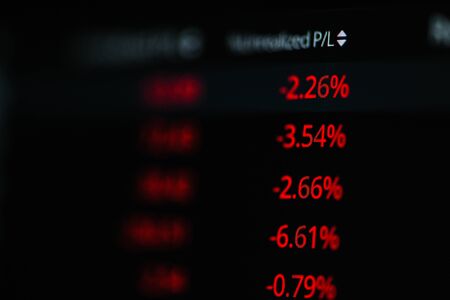
Businessman turning virtual knob measurement from low to high level for Business risk management and analysis assessment concept.
Коллекция по умолчанию
Коллекция по умолчанию
Создать новую
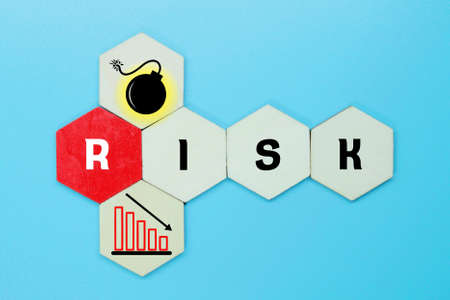
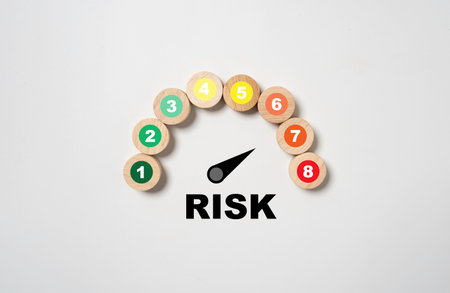
hexagon, risk icon with the word risk. Business concept
Коллекция по умолчанию
Коллекция по умолчанию
Создать новую
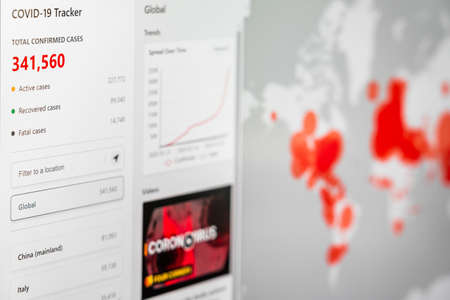
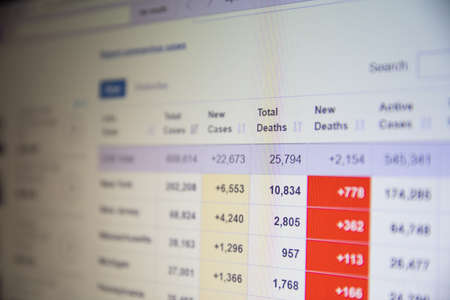
BUCHAREST, ROMANIA - MARCH 23, 2020: Coronavirus Total Cases Of The Pandemic Spreading All Around The Globe In March
Коллекция по умолчанию
Коллекция по умолчанию
Создать новую
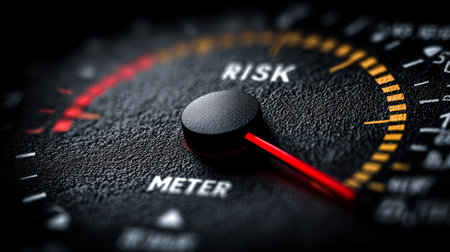
Closeup of a red needle on a risk meter, highlighting tension, alert and measurement in a detailed instrument dial.
Коллекция по умолчанию
Коллекция по умолчанию
Создать новую
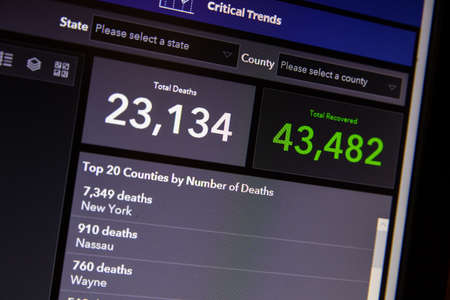
NAMPA, IDAHO - APRIL 14, 2020: John hopkins tracks deaths vs recovery
Коллекция по умолчанию
Коллекция по умолчанию
Создать новую

Hand opened blue rocket with alphabet building the word RISK. The concept of risk assessment of takes off startup
Коллекция по умолчанию
Коллекция по умолчанию
Создать новую
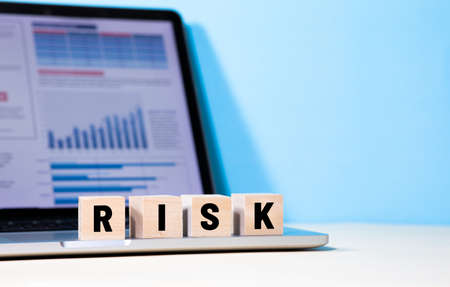
Risk and business management concepts with text on wood box on laptop.copy space
Коллекция по умолчанию
Коллекция по умолчанию
Создать новую

Shallow depth of field (selective focus) with details of a chart showing the stock market crash from March 2020 due to the Covid-19 pandemic on a computer screen (S&P500 index)
Коллекция по умолчанию
Коллекция по умолчанию
Создать новую
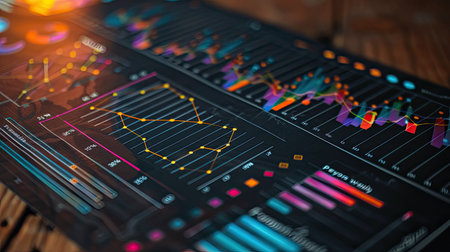
A timeline chart showing events and milestones over time AI generated
Коллекция по умолчанию
Коллекция по умолчанию
Создать новую
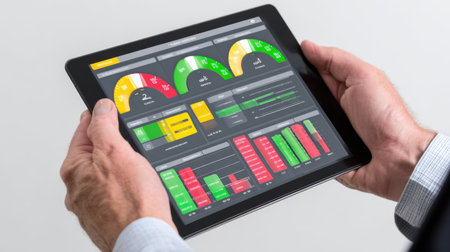
Man using laptop at table, closeup. Scale showing level of risk
Коллекция по умолчанию
Коллекция по умолчанию
Создать новую
NAMPA, IDAHO - APRIL 14, 2020: Number of deaths as per worldometers website
Коллекция по умолчанию
Коллекция по умолчанию
Создать новую
charts oil rig data
Коллекция по умолчанию
Коллекция по умолчанию
Создать новую
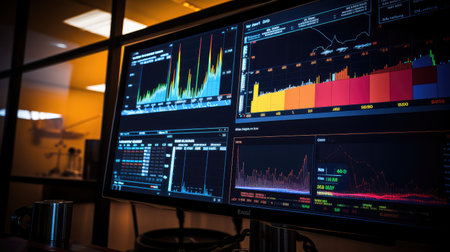
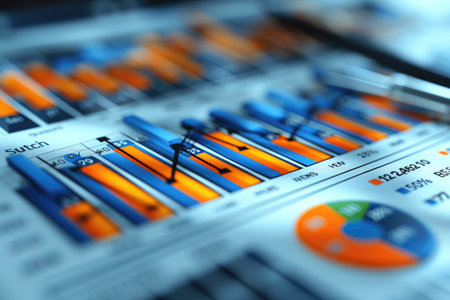
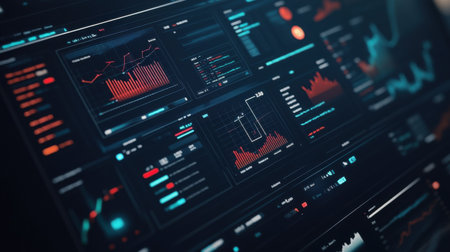
Financial data analyzing on monitor. Abstract financial data analysis on monitor.
Коллекция по умолчанию
Коллекция по умолчанию
Создать новую
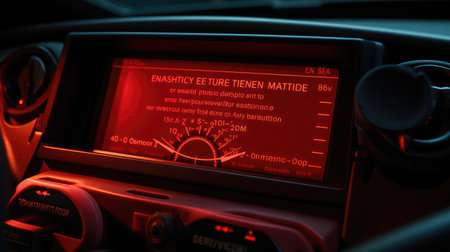
dashboard red error message
Коллекция по умолчанию
Коллекция по умолчанию
Создать новую

Color close up of a car's dashboard showing the outside temperature.
Коллекция по умолчанию
Коллекция по умолчанию
Создать новую

The word RISK is written on a bright sticker on a dark background.
Коллекция по умолчанию
Коллекция по умолчанию
Создать новую
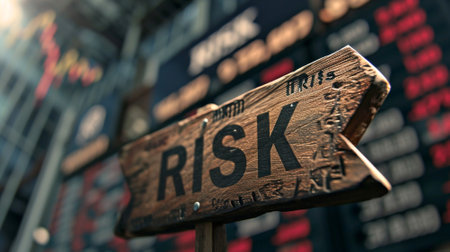
wooden sign with the word RISK, stock market exchange background
Коллекция по умолчанию
Коллекция по умолчанию
Создать новую
Stock Market Chart on Blue Background. share drop down and stock up
Коллекция по умолчанию
Коллекция по умолчанию
Создать новую
Hand holding and turning risk know from low to middle and high level meter scale from risk management analysis of business and investment concept.
Коллекция по умолчанию
Коллекция по умолчанию
Создать новую

Illuminated control panel of a car on a dark background, seen up close.
Коллекция по умолчанию
Коллекция по умолчанию
Создать новую

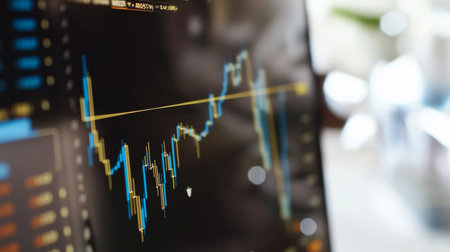
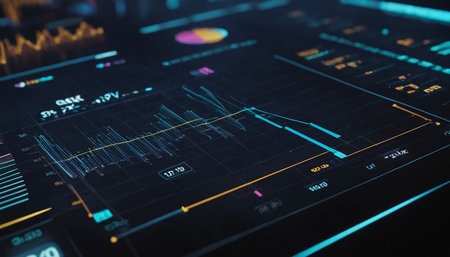
Stock market graph on screen. Ticker on monitor screen. Investing, Finance and Economic concept. Shallow depth of field.
Коллекция по умолчанию
Коллекция по умолчанию
Создать новую
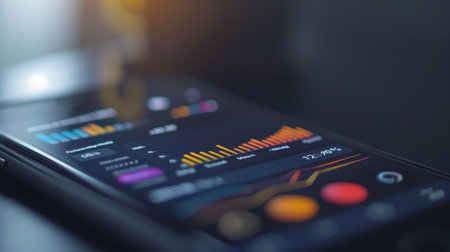
A close-up of a smartphone screen showing a financial app with graphs tracking investment performance and market trends.
Коллекция по умолчанию
Коллекция по умолчанию
Создать новую
Stock Market Trading Chart Investment Analysis Business Index Chart Finance Board Chart
Коллекция по умолчанию
Коллекция по умолчанию
Создать новую
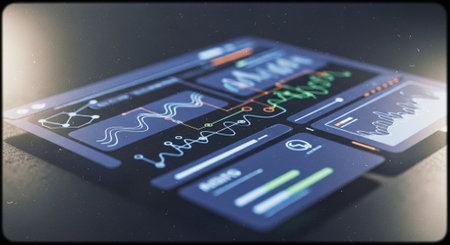
Futuristic touch user interface. 3d rendering toned image
Коллекция по умолчанию
Коллекция по умолчанию
Создать новую

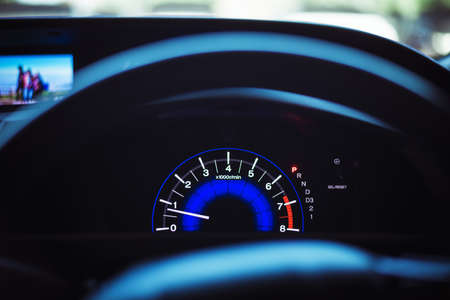
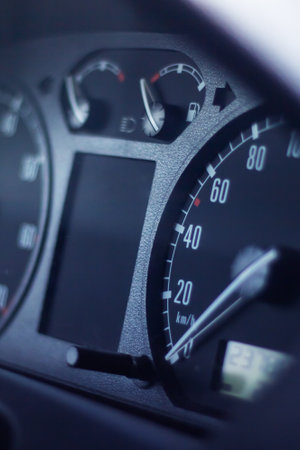
Detail of a tachometer in a car.
Коллекция по умолчанию
Коллекция по умолчанию
Создать новую
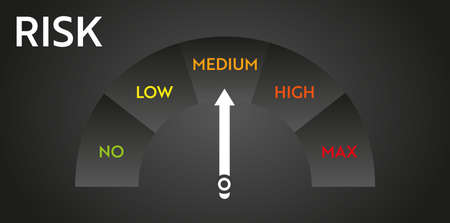
Risk level meter indicator. Stress speedometer. Chat control concept presentation
Коллекция по умолчанию
Коллекция по умолчанию
Создать новую
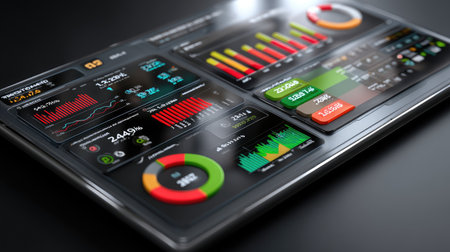
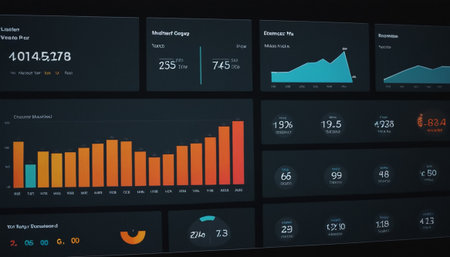
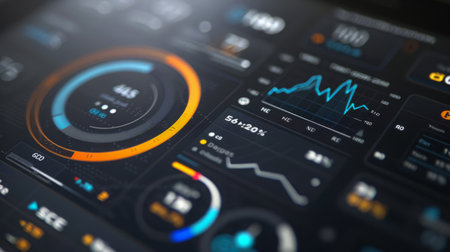
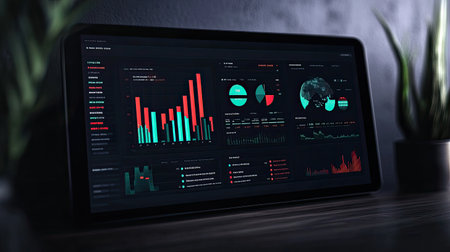
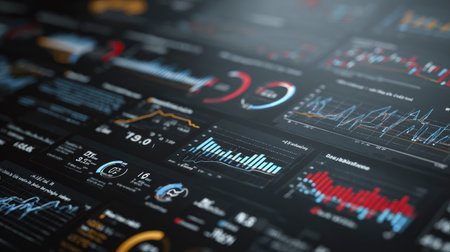
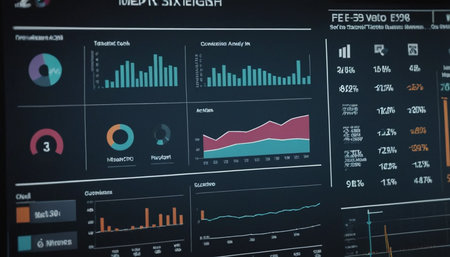
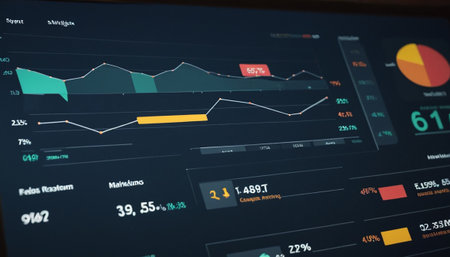
A modern digital interface featuring various data visualizations and graphs designed for analytics and monitoring, set against a dark background.
Коллекция по умолчанию
Коллекция по умолчанию
Создать новую
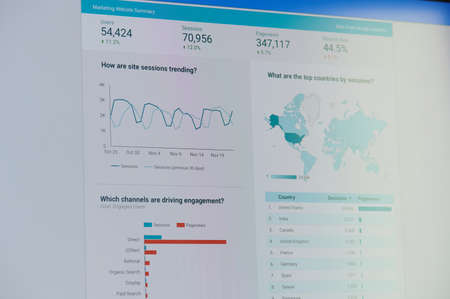
New york, USA - November 24, 2020: Google ads marketing website summarydashboard on laptop screen
Коллекция по умолчанию
Коллекция по умолчанию
Создать новую
Futuristic interface display with charts and graphs. 3D rendering
Коллекция по умолчанию
Коллекция по умолчанию
Создать новую
Businessman in risk metering and management concept
Коллекция по умолчанию
Коллекция по умолчанию
Создать новую

A close up of a red button that says risk on it, AI
Коллекция по умолчанию
Коллекция по умолчанию
Создать новую

Bishkek, Kyrgyzstan - March 14, 2020: Discord voice communication app for remote work or study.
Коллекция по умолчанию
Коллекция по умолчанию
Создать новую
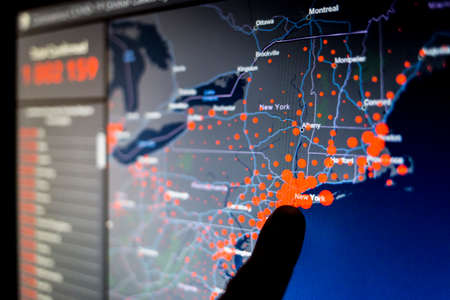
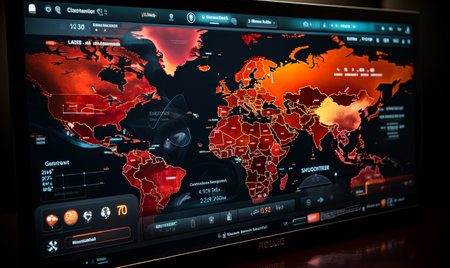
Over 1 million. Number of Total Confirmed Cases. Expert point Coronavirus COVID-19 global cases Map Johns Hopkins University map on monitor display.
Коллекция по умолчанию
Коллекция по умолчанию
Создать новую
Stock market data on monitor. Financial graph on monitor. Stock market data on monitor. Stock market data on monitor. Business graph on monitor. Stock market data on monitor.
Коллекция по умолчанию
Коллекция по умолчанию
Создать новую
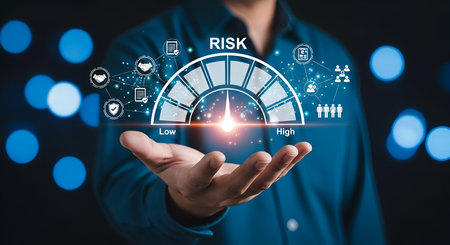
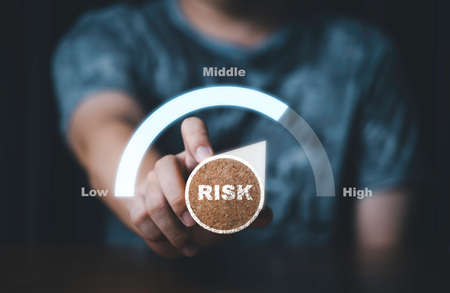
A person's outstretched hand holds a semi-circular risk meter. The meter displays a dial indicating a position between Low and High risk, with a glowing indicator. Icons representing business processes, security, and teamwork are connected around the meter. The background features blurred bokeh lights, creating a sense of depth and focus on the risk assessment concept.
Коллекция по умолчанию
Коллекция по умолчанию
Создать новую
A speed meter is gauge that measures and displays,Car dashboard display symbol
Коллекция по умолчанию
Коллекция по умолчанию
Создать новую
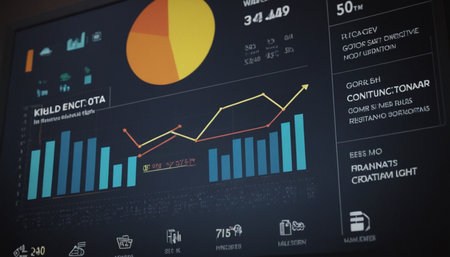
Close Up Of A Digital Display Showing Data And Charts
Коллекция по умолчанию
Коллекция по умолчанию
Создать новую
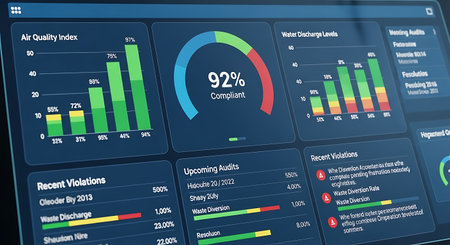
a digital dashboard showing air quality water discharge and compliance with data visualization and statistics
Коллекция по умолчанию
Коллекция по умолчанию
Создать новую
Individual holds a tablet displaying collapsing dashboard data while seated in a dark environment. The focus is on data analysis.
Коллекция по умолчанию
Коллекция по умолчанию
Создать новую
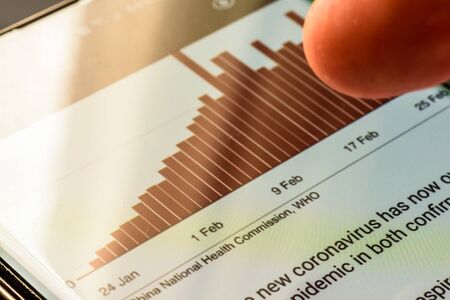
coronavirus covid 19 graph on smart phone screen - Northampton, UK - February 25, 2020
Коллекция по умолчанию
Коллекция по умолчанию
Создать новую
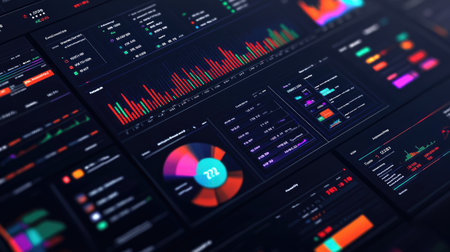
Shopee data dashboard showcasing trend indicators, sales performance, and pie charts on a dark interface, with ample room for copy.
Коллекция по умолчанию
Коллекция по умолчанию
Создать новую
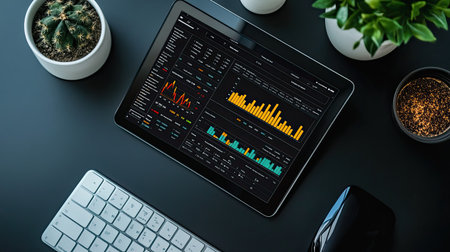
Tablet with business dashboard interface shown on screen against white backdrop
Коллекция по умолчанию
Коллекция по умолчанию
Создать новую
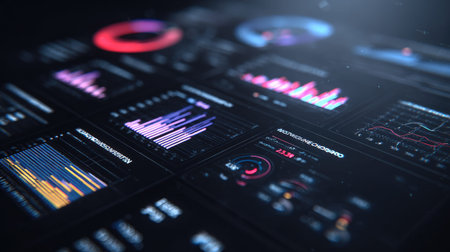
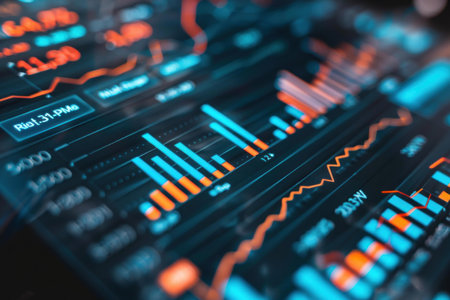
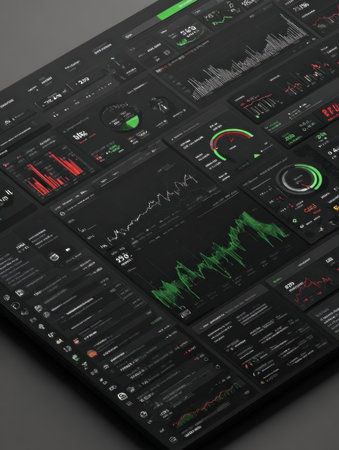
This image features an intricate layout of modern data visualizations, showcasing various colorful graphs and charts ideal for business analytics and performance reviews.
Коллекция по умолчанию
Коллекция по умолчанию
Создать новую
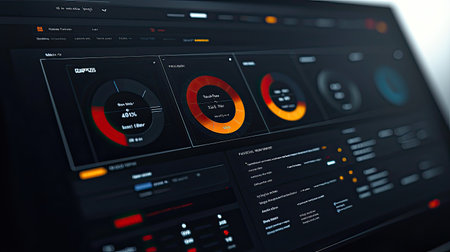
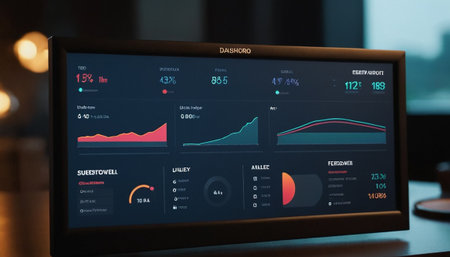
A sleek digital dashboard featuring vibrant data visualizations and user-friendly interface elements, perfect for technology and analytics projects.
Коллекция по умолчанию
Коллекция по умолчанию
Создать новую
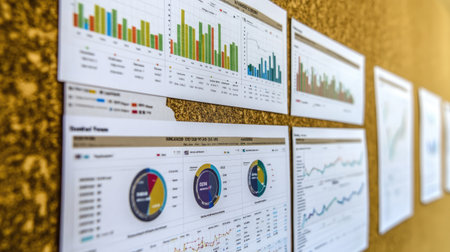
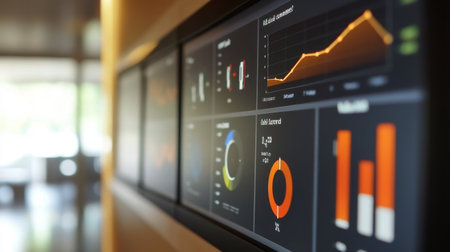
This image showcases a bulletin board displaying various business performance metrics through colorful charts and graphs, ideal for professional analysis and team discussions.
Коллекция по умолчанию
Коллекция по умолчанию
Создать новую

Glowing data charts displayed on a laptop signify analysis in a contemporary office setting during evening hours.
Коллекция по умолчанию
Коллекция по умолчанию
Создать новую
An AI-powered supply chain data analytics system, showing inventory levels, logistics metrics, and demand forecasts. This image emphasizes the role of AI in supply chain management.
Коллекция по умолчанию
Коллекция по умолчанию
Создать новую
Strategic business planning for 2025 with graphs and financial data, highlighting new year goals and growth.
Коллекция по умолчанию
Коллекция по умолчанию
Создать новую
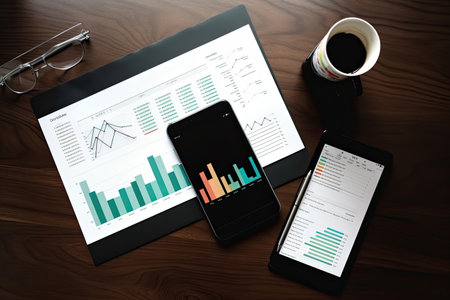
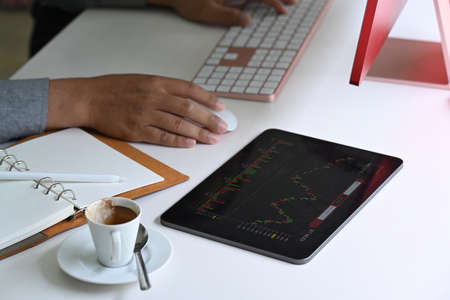
Smartphone and Tablet pc with financial charts and graphs on office desk, business concept
Коллекция по умолчанию
Коллекция по умолчанию
Создать новую
Digitally generated image of financial charts and graphs against black background
Коллекция по умолчанию
Коллекция по умолчанию
Создать новую
A close-up of a financial dashboard with growth charts and profit reports, providing space to add insights on economic growth, investment strategies, or market expansion
Коллекция по умолчанию
Коллекция по умолчанию
Создать новую
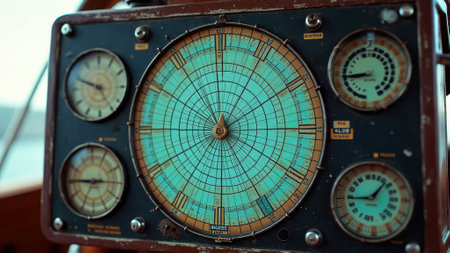
Vintage nautical instrument panel with analog displays and compass. That the image is generated using AI.
Коллекция по умолчанию
Коллекция по умолчанию
Создать новую
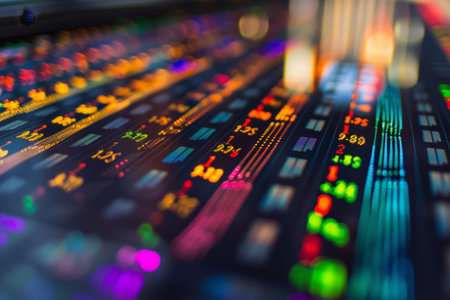
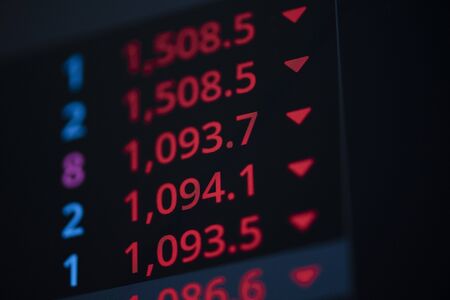
A colorful display of numbers and symbols on a screen. The colors are bright and vibrant, creating a sense of energy and excitement. The image could be related to finance, technology
Коллекция по умолчанию
Коллекция по умолчанию
Создать новую
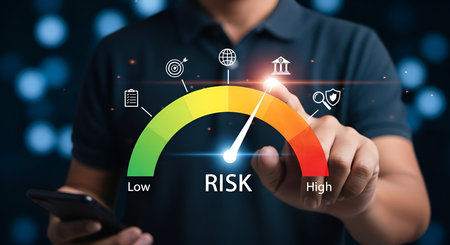
A person is touching a digital risk meter displayed on a screen. The meter shows a range from Low to High risk, with a needle pointing towards the higher end. Icons representing goals, documents, a globe, a building, a magnifying glass, and security shields are positioned around the meter, illustrating various aspects of risk assessment.
Коллекция по умолчанию
Коллекция по умолчанию
Создать новую
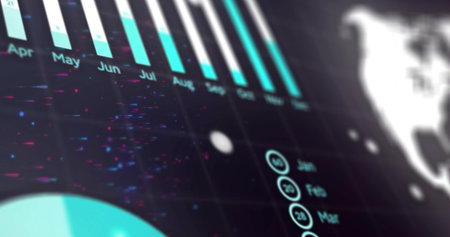
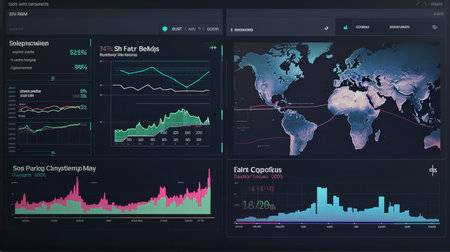
Displaying data dashboard on screen in dark workspace, showing teal bars, circular segment, map. Neon, futuristic, visualization, analytics, monitor, interface, night
Коллекция по умолчанию
Коллекция по умолчанию
Создать новую
Futuristic screen with charts and graphs. 3d rendering.
Коллекция по умолчанию
Коллекция по умолчанию
Создать новую

Modern car panel, digital bright speedometer, odometer.
Коллекция по умолчанию
Коллекция по умолчанию
Создать новую

Car dashboard interior view. Car instrument panel with tachometer and speedometer. View from steering wheel to rpm gauge and speed meter. Car engine indicator. Closeup dashboard with auto light.
Коллекция по умолчанию
Коллекция по умолчанию
Создать новую
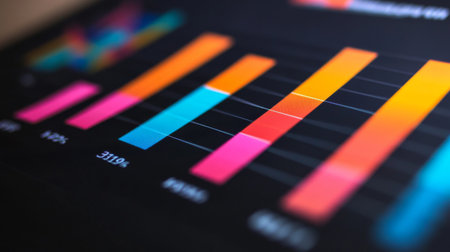
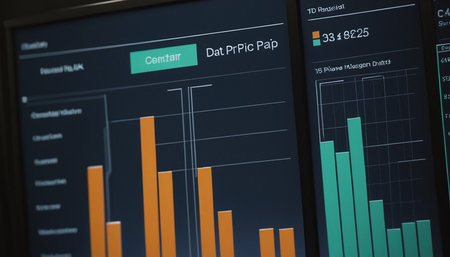
Vibrant bar graph displayed on a digital screen, showcasing data insights and trends for business analysis. Ideal for presentations and reports.
Коллекция по умолчанию
Коллекция по умолчанию
Создать новую
Analysis data graph professional photography
Коллекция по умолчанию
Коллекция по умолчанию
Создать новую

Wooden blocks spelling Risk on the table
Коллекция по умолчанию
Коллекция по умолчанию
Создать новую
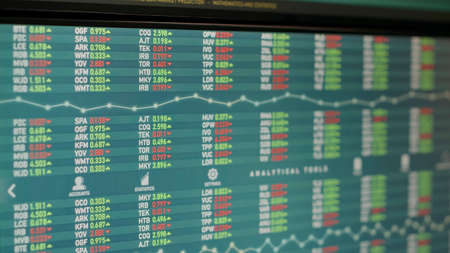
Real time stock sales statistics with global hedge fund on monitor, trade exchange numbers changing after buying and selling money. Financial investment with profit. Close up. Tripod shot.
Коллекция по умолчанию
Коллекция по умолчанию
Создать новую
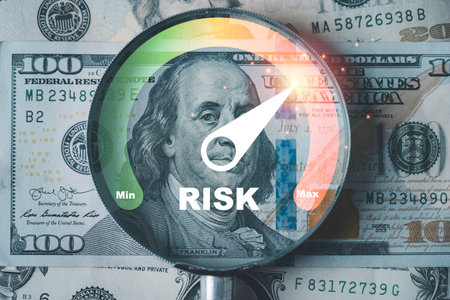
Financial risk concept showing a magnifying glass over US dollar bills with a risk gauge pointing to maximum level symbolizing investment danger finance uncertainty and market volatility
Коллекция по умолчанию
Коллекция по умолчанию
Создать новую
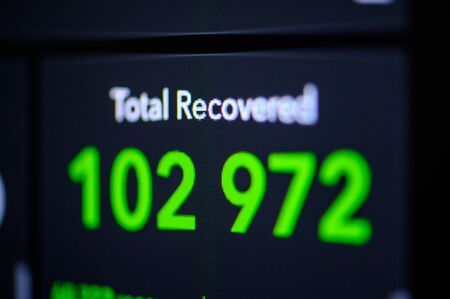
Green Number of Total Recovered from . Coronavirus COVID-19 global cases Map. Red Dot showing the number of infected. Johns Hopkins University map on monitor display.
Коллекция по умолчанию
Коллекция по умолчанию
Создать новую
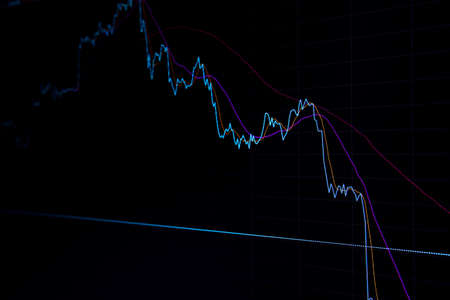
Change the stock market chart. The fall in the value of cryptocurrencies. Brokerage data
Коллекция по умолчанию
Коллекция по умолчанию
Создать новую
This image showcases a modern dashboard filled with colorful graphs and data visualizations, ideal for illustrating business performance and analytical insights.
Коллекция по умолчанию
Коллекция по умолчанию
Создать новую
Businessman touching to colorful risk scale indicator and analysis for evaluation business investment risk before decision and judgment concept.
Коллекция по умолчанию
Коллекция по умолчанию
Создать новую
Stock market exchange graph price drop with red numbers investment lose of business financial digital background / charts stock crash crisis fall risk decreasing arrow down trend sell
Коллекция по умолчанию
Коллекция по умолчанию
Создать новую

Business success and growth concept.Stock market business graph chart on digital screen. Stock trading, crypto currency background.
Коллекция по умолчанию
Коллекция по умолчанию
Создать новую
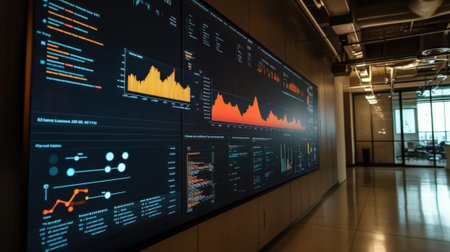
Modern data visualization displayed on a large screen showcases graphs and charts reflecting financial performance metrics in a contemporary office setting.
Коллекция по умолчанию
Коллекция по умолчанию
Создать новую
A closeup of a cars speedometer displaying a speed 0 close up
Коллекция по умолчанию
Коллекция по умолчанию
Создать новую

Businessman in suit holding of K wood block and removed with the word RISK. The concept of reducing risks and financial risk assessment, risk reward and portfolio risk management concept.
Коллекция по умолчанию
Коллекция по умолчанию
Создать новую
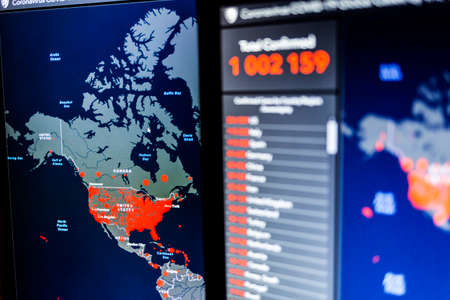
Over 1 million. Number of Total Confirmed Cases. Coronavirus COVID-19 global cases Map Johns Hopkins University map on monitor display.
Коллекция по умолчанию
Коллекция по умолчанию
Создать новую
A focused shot of a large screen featuring realtime data visualization tools showcasing interactive segments filled with KPIs and metrics. The screen highlights areas of performanc
Коллекция по умолчанию
Коллекция по умолчанию
Создать новую

old cars. vintage car. retro car. wheels and engine. body and interior. control mechanisms.
Коллекция по умолчанию
Коллекция по умолчанию
Создать новую
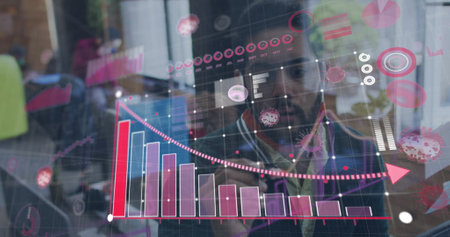
Image of statistics recording and covid 19 cells over man drawing in office wearing face mask. global covid 19 pandemic, health and medicine concept digitally generated image.
Коллекция по умолчанию
Коллекция по умолчанию
Создать новую

image of the financial graph on a computer monitor.
Коллекция по умолчанию
Коллекция по умолчанию
Создать новую
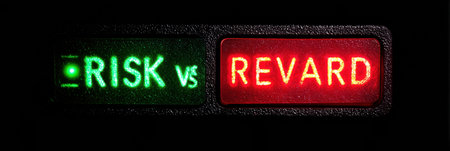
A scale illustrating the concept of risk versus reward features green and red light icons, clearly demonstrating contrasting values in decision making.
Коллекция по умолчанию
Коллекция по умолчанию
Создать новую
Risk level indicator rating print screen wooden cube block since low to high on white background for Risk management and assessment concept.
Коллекция по умолчанию
Коллекция по умолчанию
Создать новую
Close up businessman working with computer laptop.
Коллекция по умолчанию
Коллекция по умолчанию
Создать новую
Close up of a vibrant financial data dashboard with dynamic charts and graphs on a digital screen
Коллекция по умолчанию
Коллекция по умолчанию
Создать новую
Close-up of a financial graph on a computer screen, showcasing upward and downward trends with detailed line and bar charts.
Коллекция по умолчанию
Коллекция по умолчанию
Создать новую
View of Stock Market Crash from Covid-19 Pandemic with shallow depth of field.
Коллекция по умолчанию
Коллекция по умолчанию
Создать новую

Business Risk Gauge with Low to High Indicator. A hand holding magnifying glass over a risk gauge, showing a scale from low to high, symbolizing the concept of business risk assessment and management.
Коллекция по умолчанию
Коллекция по умолчанию
Создать новую

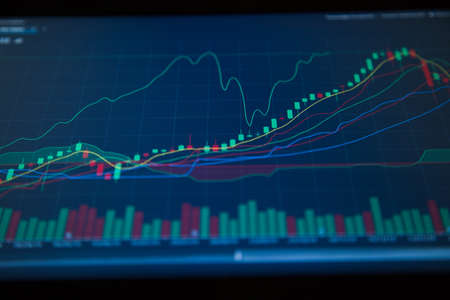
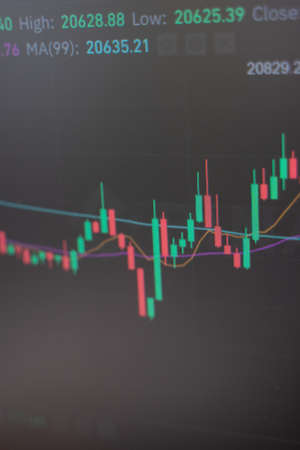
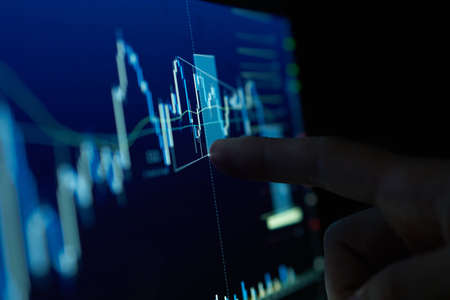
Shallow depth of field (selective focus) with details of a candlestick chart on a computer screen.
Коллекция по умолчанию
Коллекция по умолчанию
Создать новую
A detailed shot of a smart home dashboard monitoring energy and water usage, illustrating technology-driven sustainable living,
Коллекция по умолчанию
Коллекция по умолчанию
Создать новую
A close-up of a high-resolution computer screen reveals a detailed Python script focused on data cleaning and preprocessing techniques for data analysis.
Коллекция по умолчанию
Коллекция по умолчанию
Создать новую
A close-up of a stock market trading screen displaying fluctuating graphs and charts of various stocks.
Коллекция по умолчанию
Коллекция по умолчанию
Создать новую
Stock market data on LED screen. Finance and trade concept. 3D Rendering
Коллекция по умолчанию
Коллекция по умолчанию
Создать новую
An interactive crowdfunding dashboard showcases real-time analytics, featuring detailed graphs and charts that track campaign performance metrics effectively. User engagement is highlighted.
Коллекция по умолчанию
Коллекция по умолчанию
Создать новую

Glowing car speedometer close-up view background. Luxury dashboard with round speedometer inside sport car photo
Коллекция по умолчанию
Коллекция по умолчанию
Создать новую
A visually striking financial dashboard showcasing real-time data and insights, ideal for business analytics and decision-making processes.
Коллекция по умолчанию
Коллекция по умолчанию
Создать новую
A computer screen displaying a detailed map of the world, showing continents, countries, and geographical features.
Коллекция по умолчанию
Коллекция по умолчанию
Создать новую
A close-up of a tablet displaying a marketing automation dashboard, with workflows and email campaigns in progress. . --ar 16:7 --v 6.1 Job ID: 6394e9d2-fafa-4b8e-bdb9-709c6efc044f
Коллекция по умолчанию
Коллекция по умолчанию
Создать новую
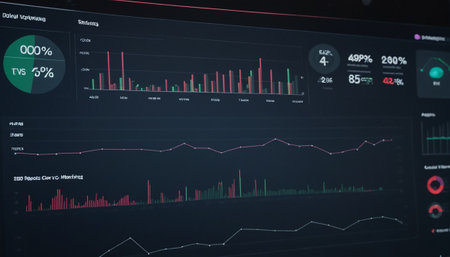
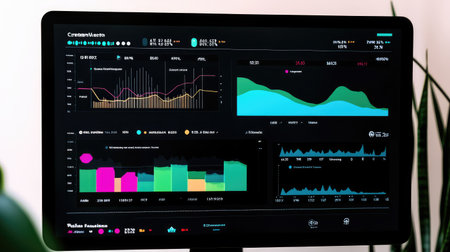
Dynamic financial dashboard displays various metrics, charts, and analytics for market performance, capturing live changes in stock and cryptocurrency values.
Коллекция по умолчанию
Коллекция по умолчанию
Создать новую
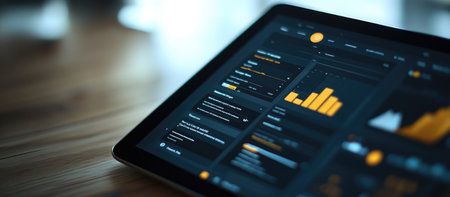
A minimalist workspace with a sleek tablet showing a simple yet informative business graph and key data points.
Коллекция по умолчанию
Коллекция по умолчанию
Создать новую
securities price chart on the monitor screen
Коллекция по умолчанию
Коллекция по умолчанию
Создать новую
Stock market data on monitor. Abstract stock market data on monitor. Stock market data on monitor. Stock market data on monitor. Business finance data on monitor. Stock market data on monitor.
Коллекция по умолчанию
Коллекция по умолчанию
Создать новую
Close-up view of laptop screen with graphs and charts on screen
Коллекция по умолчанию
Коллекция по умолчанию
Создать новую
Program, programming, program, screen, monitor, computer, laptop, hacker, hacking.
Коллекция по умолчанию
Коллекция по умолчанию
Создать новую
Legion-Media
Создайте свои проекты на основе качественных стоковых фотографий и видео.


Copyright © Legion-Media.